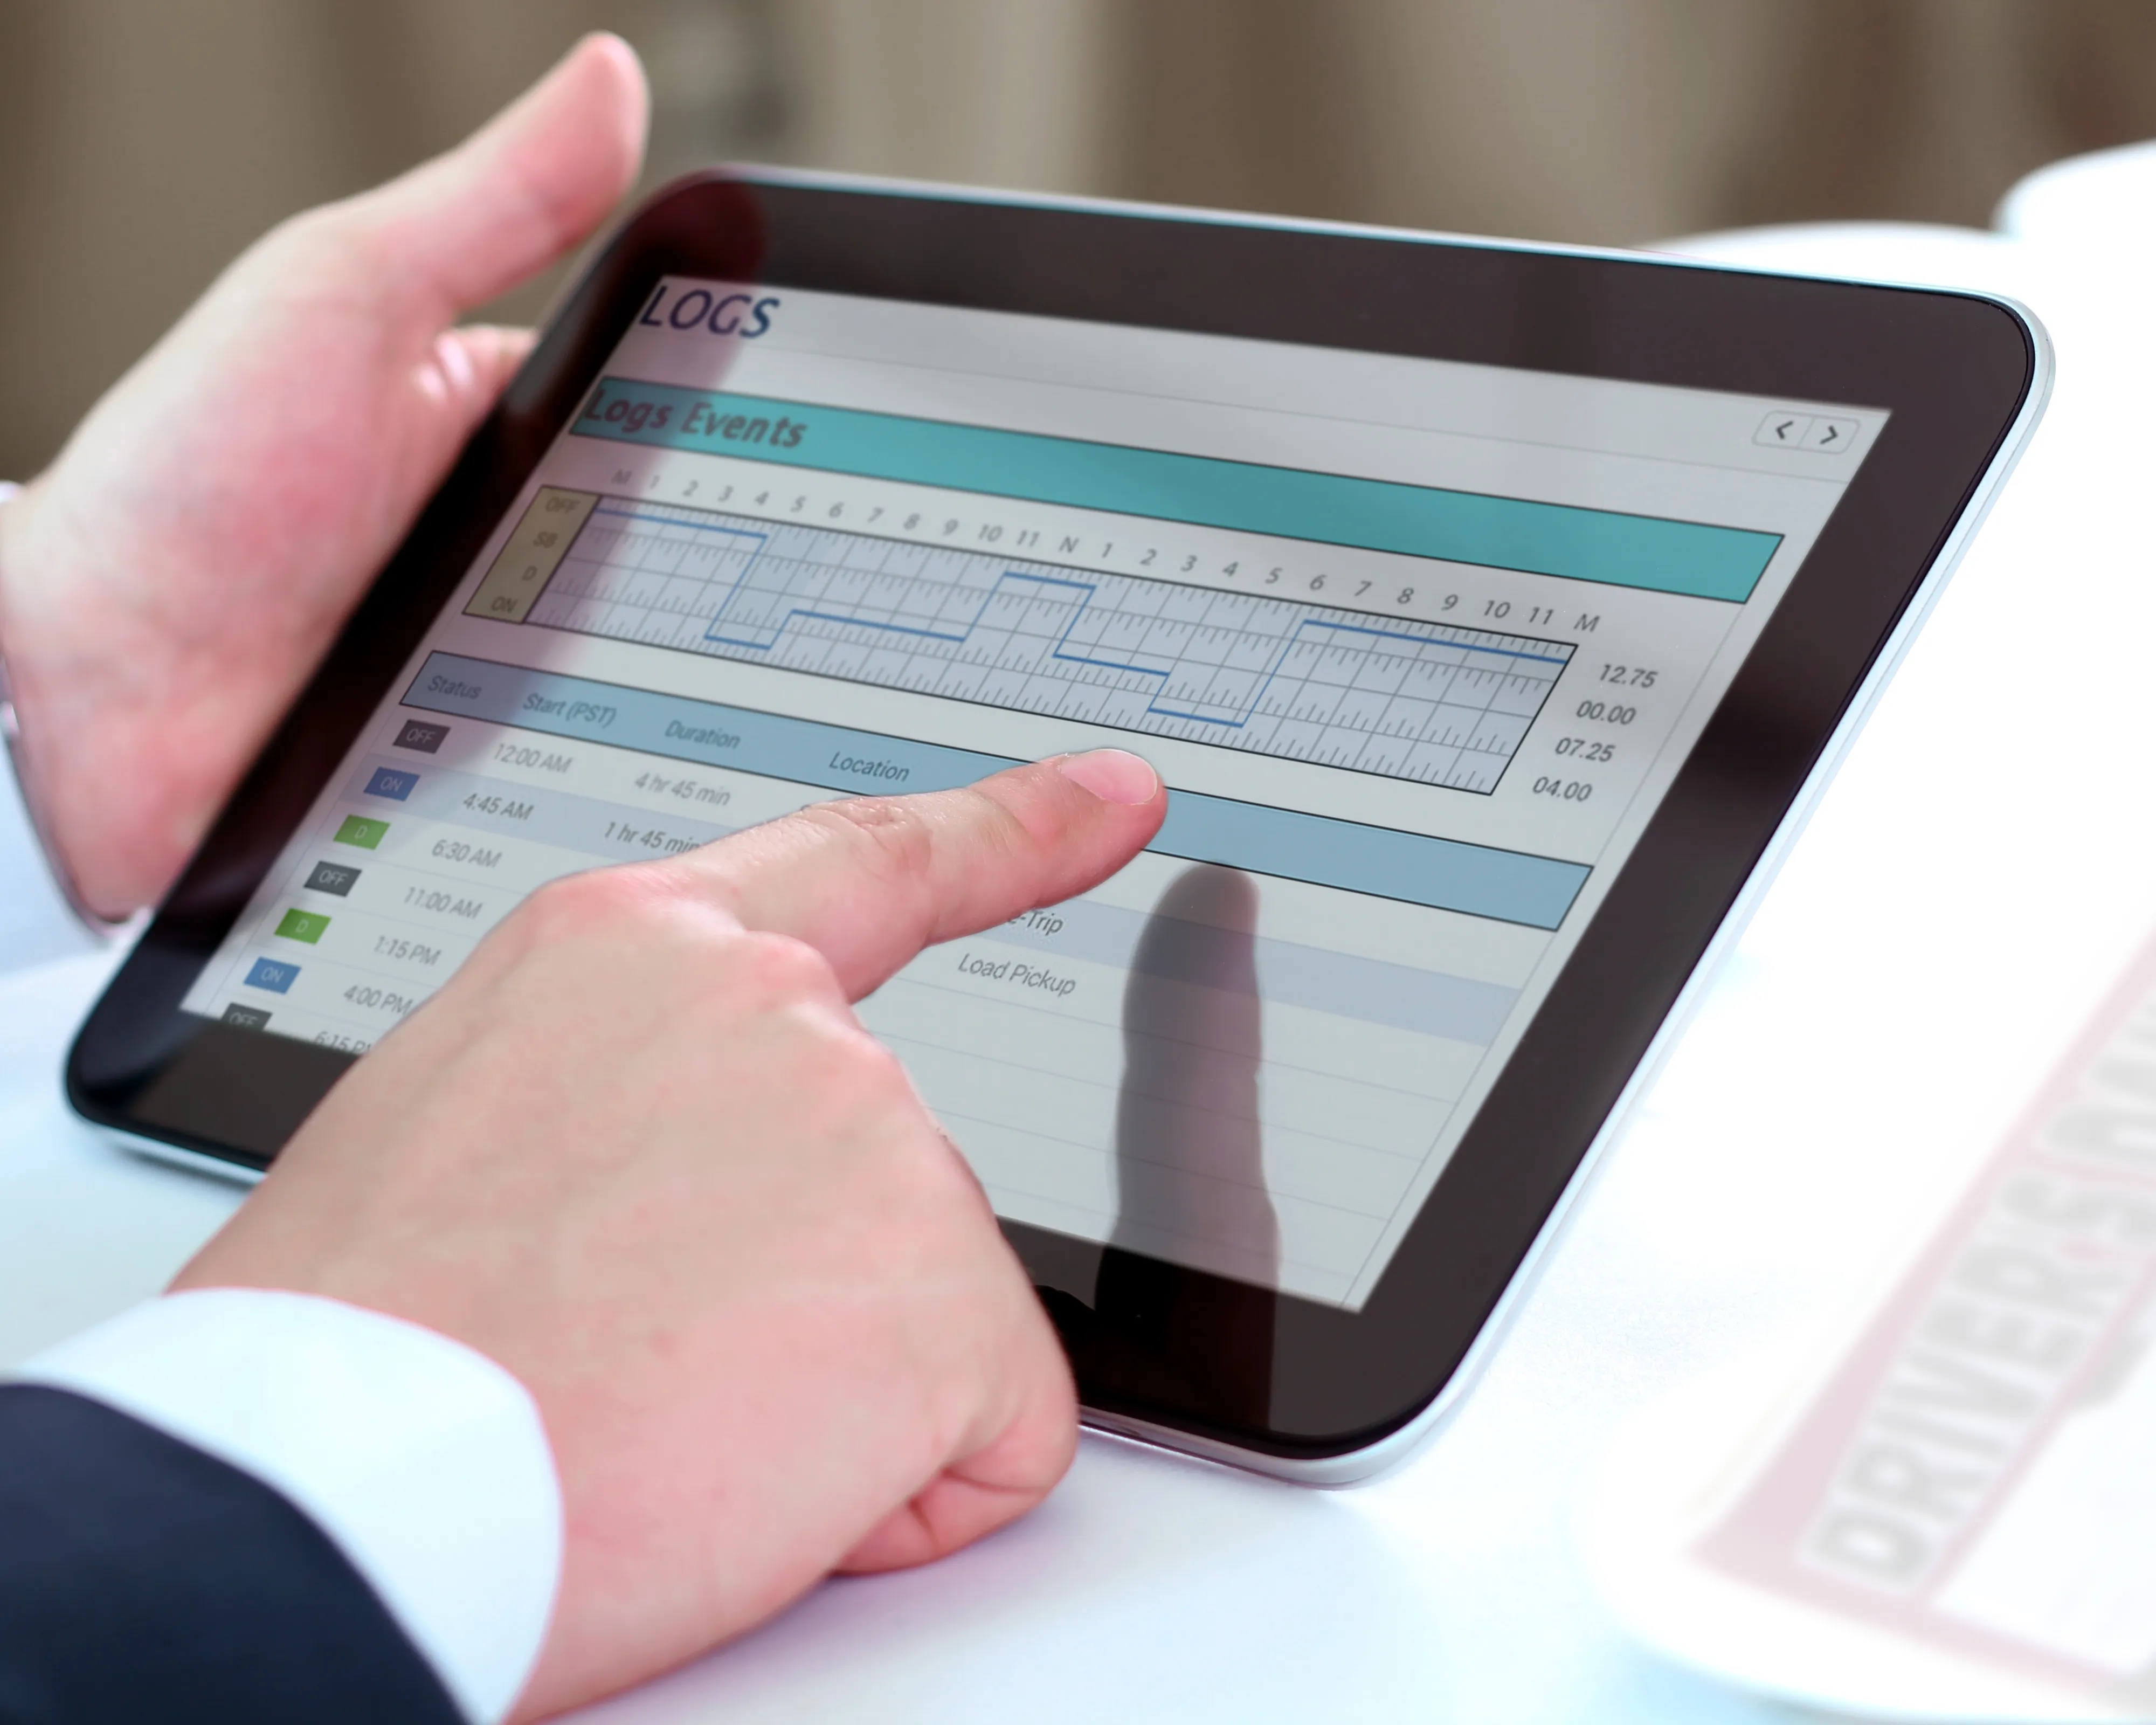
Manual Logbooks
Shift data recorded on paper or Excel, no version control, no alerts, no accountability.
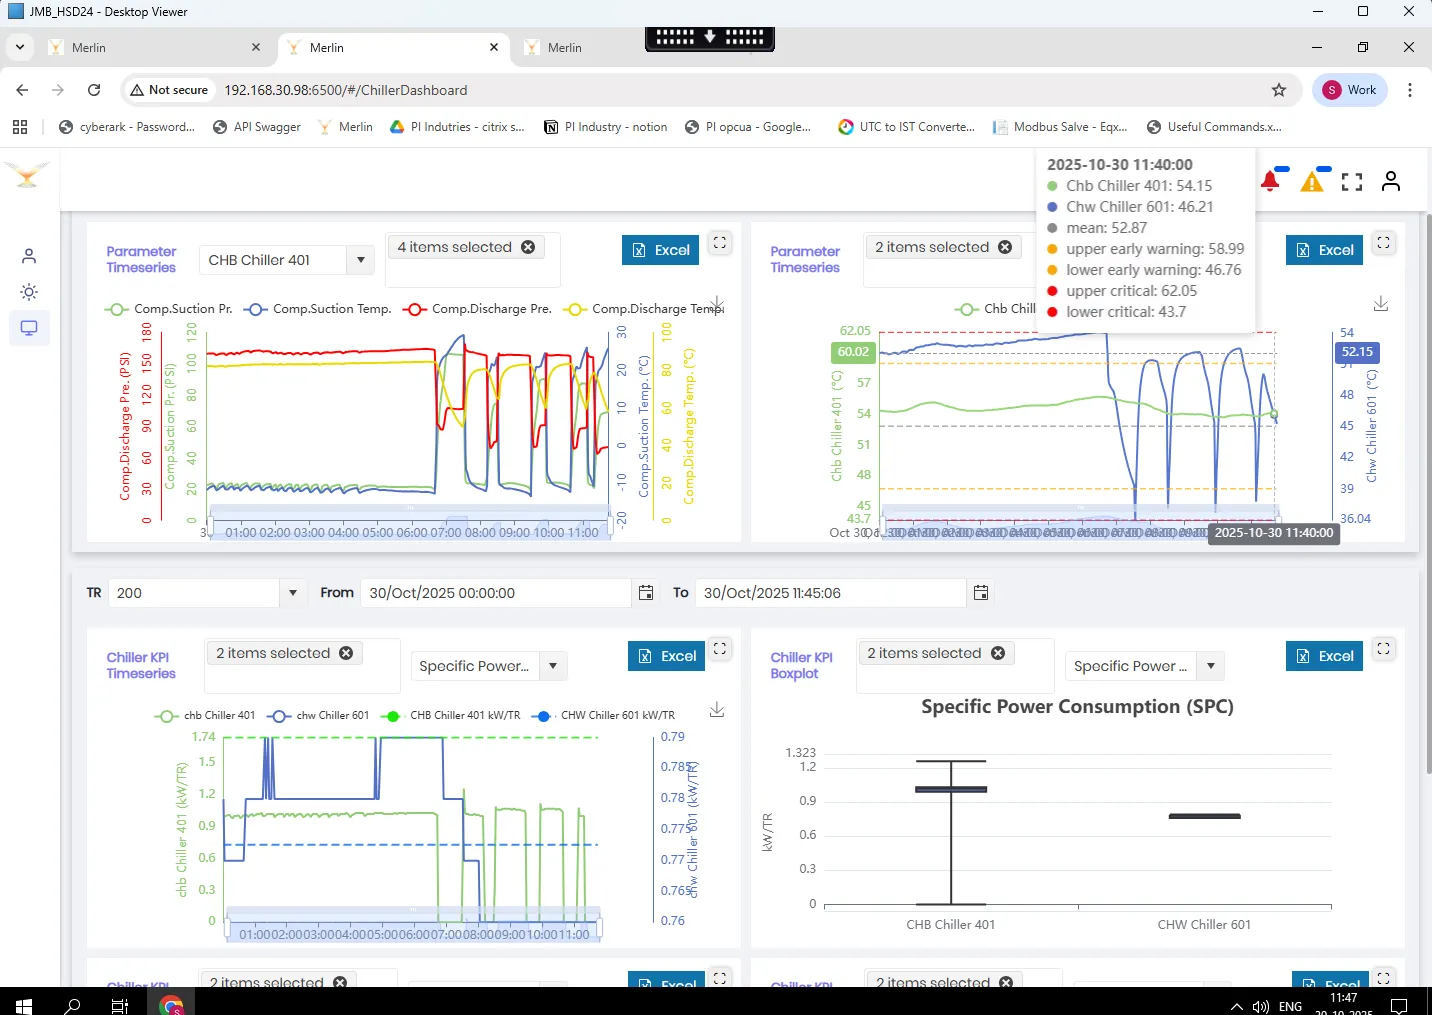
MERLIN UEMS
From manual logbooks to real-time KPI visibility across every chiller, compressor, and energy meter in your facility.
Projects
120+
Clients
40+
Uptime
99.9%
80+
Chillers Tracked
100+
KPIs Monitored
LISTED
Deployment
99.9%
Uptime
THE CHALLENGE
Shift data recorded on paper or Excel, no version control, no alerts, no accountability.
Faults discovered after they cause downtime, not before. No early warning system in place.
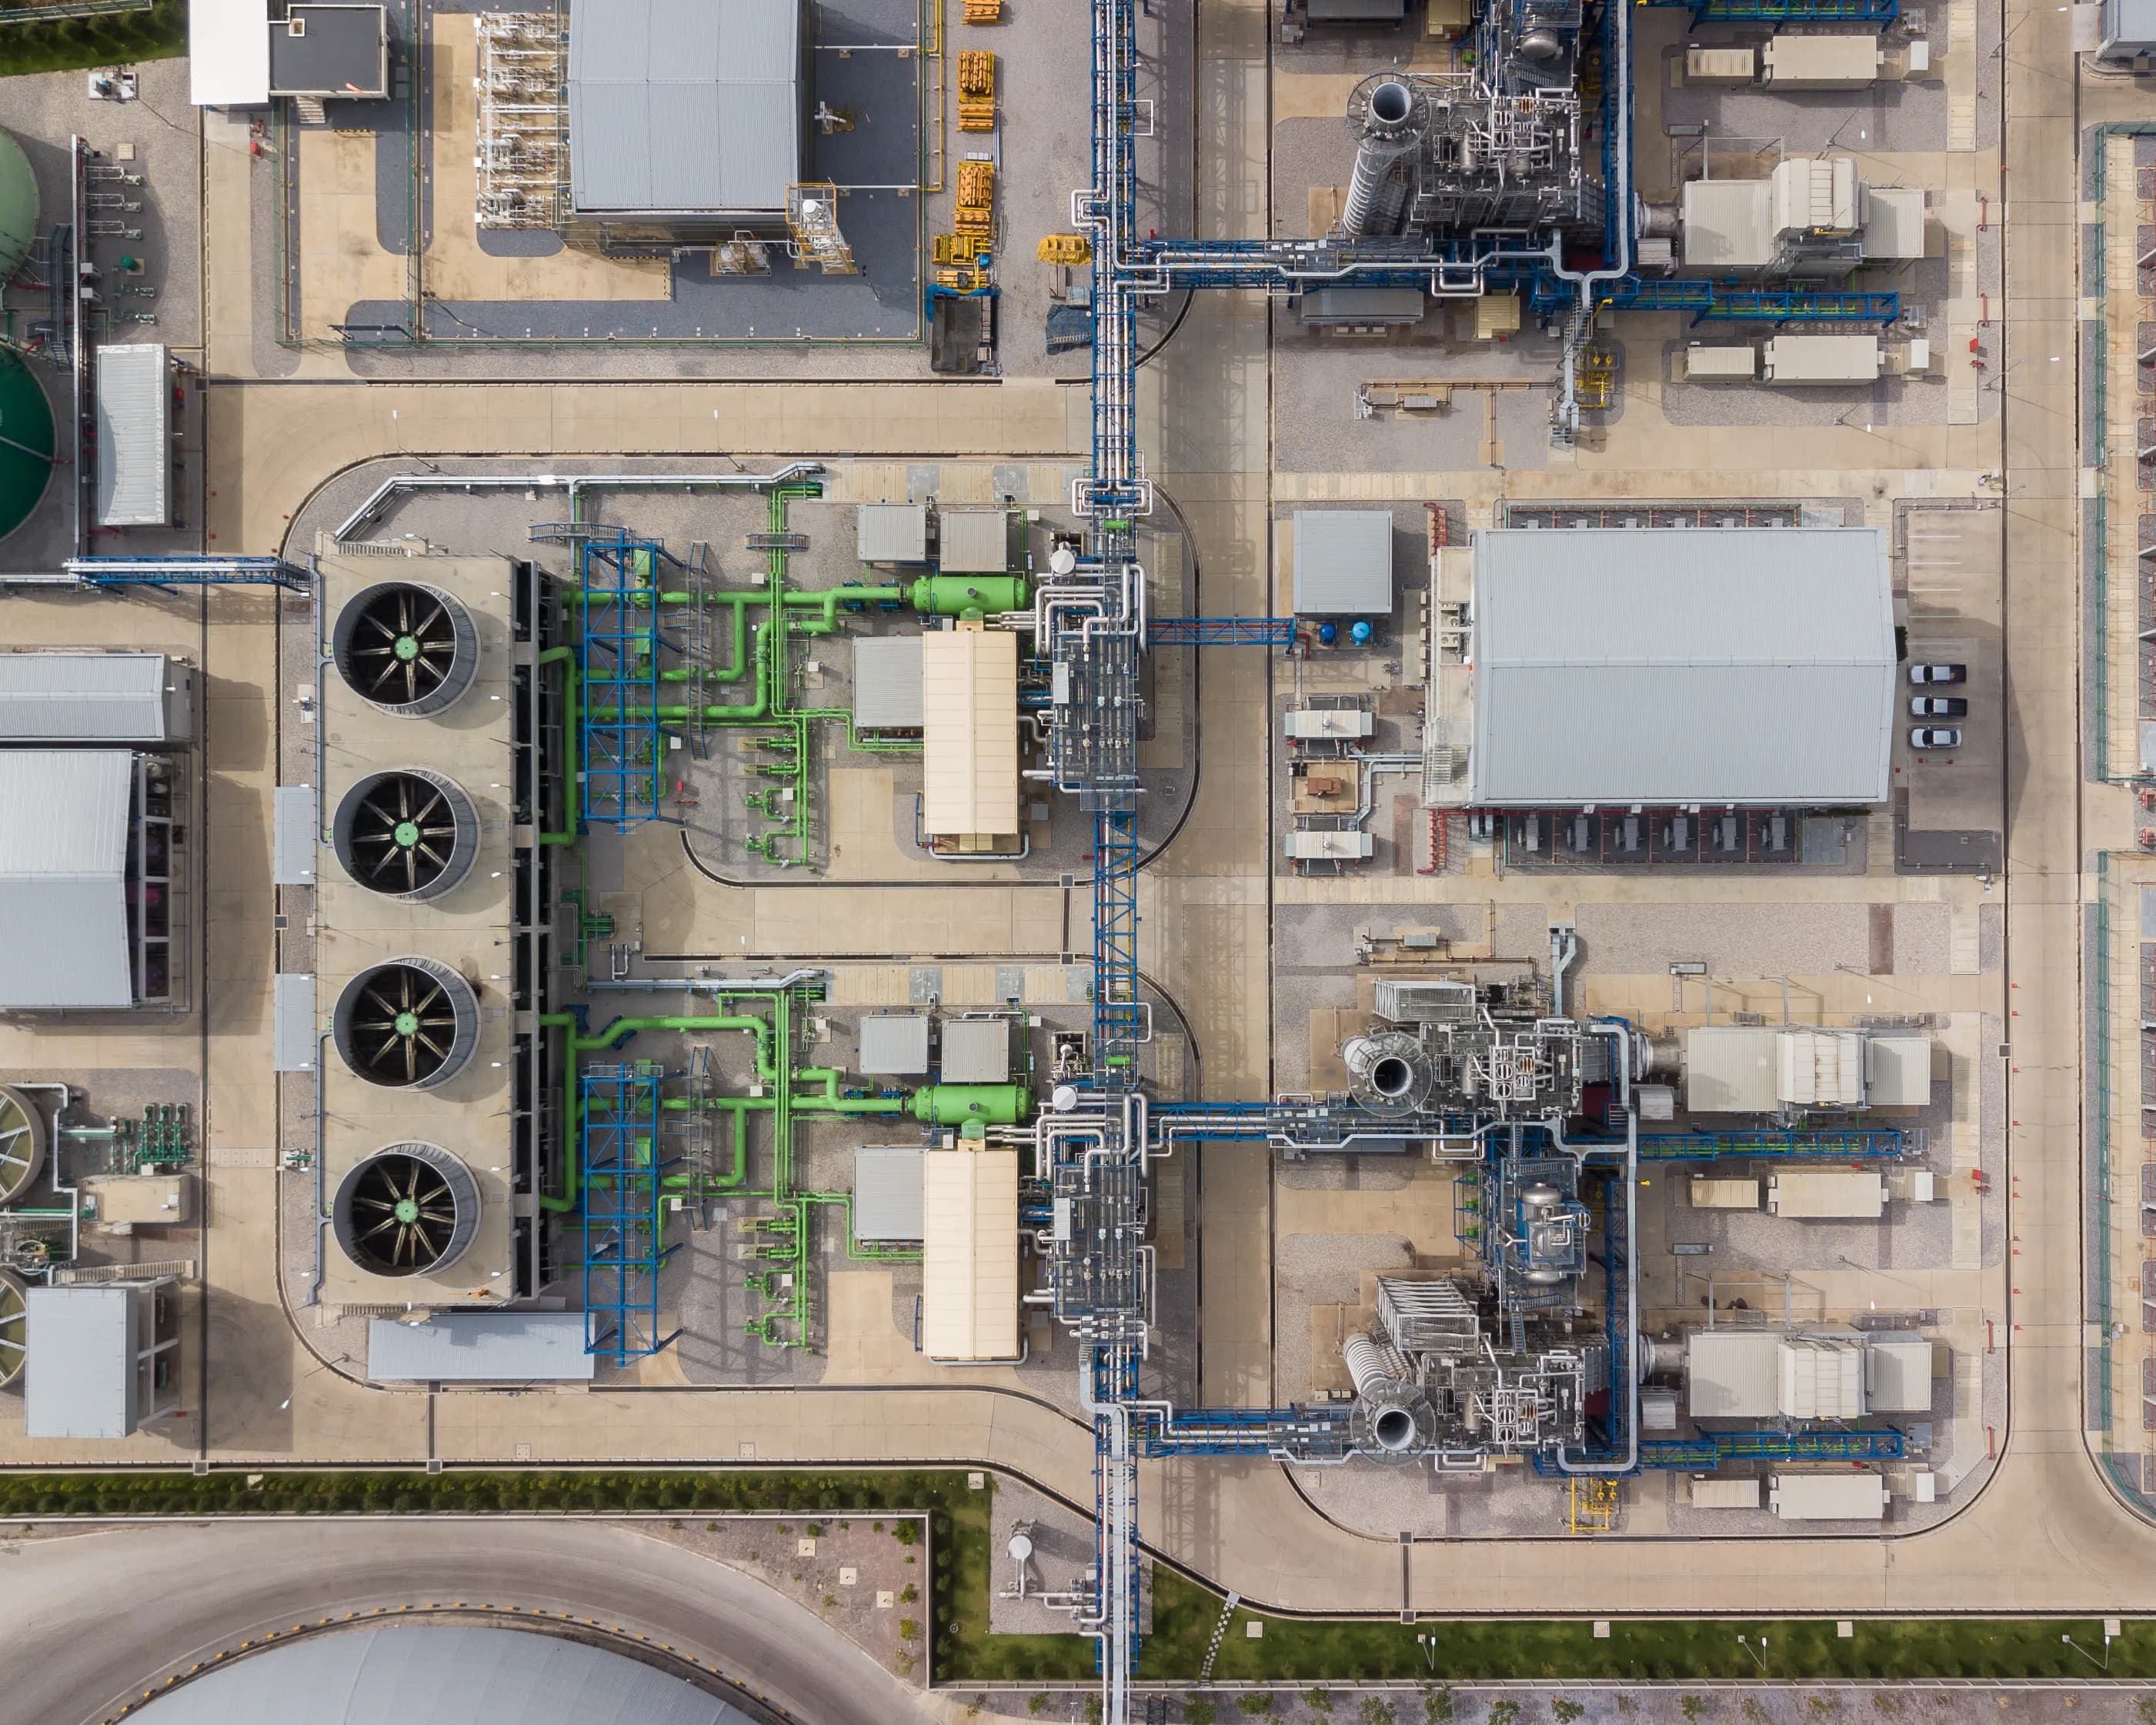
Chillers, compressors, and meters tracked in silos. No unified view of plant utility health.
THE SOLUTION
Track every critical parameter across chillers, compressors, nitrogen plants, and energy meters in real time. Dedicated monitoring modules per asset type with parameters and KPIs tailored to how each asset actually behaves.

Track every critical parameter across chillers, compressors, nitrogen plants, and energy meters in real time. Dedicated monitoring modules per asset type with parameters and KPIs tailored to how each asset actually behaves.
Replace paper registers with structured shift entries. Every reading is validated against min/max limits, version-tracked, and tied to an operator login. Full audit trail always available.
Replace paper registers with structured shift entries. Every reading is validated against min/max limits, version-tracked, and tied to an operator login. Full audit trail always available.
Every parameter breach is captured with start time, end time, duration, and exact trigger value. No fault goes unrecorded. No alert gets missed.

Every parameter breach is captured with start time, end time, duration, and exact trigger value. No fault goes unrecorded. No alert gets missed.
Live plant topology with real-time status per asset. Green, amber, and red indicators give operators instant situational awareness from a single screen.
Live plant topology with real-time status per asset. Green, amber, and red indicators give operators instant situational awareness from a single screen.
Analytics and Reporting
A single platform to monitor, track, and manage all plant utilities in real time improving visibility, control, and operational efficiency.
Trend utility KPIs over time to detect drift and performance shifts early.
Compare multi-asset KPI intensity at a glance with color-coded hotspot views.
Prioritize interventions using a consolidated health score for every asset.
Track threshold breaches in real time with context for faster corrective action.
HOW IT WORKS
We securely collect, integrate, and organize utility data from plant assets, ensuring accuracy, consistency, and operational traceability from day one.
Unified dashboards transform live utility data into clear, actionable visibility so teams can monitor, control, and respond with confidence in real time.
Advanced analytics deliver insights, automated reporting, and reliable forecasts that support smarter, data-driven decisions across utility operations.
Supports your existing plant communication infrastructure
BUSINESS IMPACT
2-3
Hours Saved Per Shift
Per Operator, Per Shift
2-3 hrs saved per operator per shift by eliminating manual log compilation.
3-5%
Efficiency Gains
Through Live KPI Tracking
3-5% efficiency gains through live tracking of kW/TR, delta-T and utilisation.
20-30%
Downtime Reduction
Unplanned Downtime Avoided
20-30% reduction in unplanned downtime through early anomaly detection.
Trusted By
Trusted by GFL, PI Industries for utility monitoring and operational control.


Deployable As
Compliant With
Get Started
Book a personalised walkthrough or share your site details for a tailored deployment plan.