No Fleet-Wide View
Plant managers juggle multiple dashboards, spreadsheets, and OEM portals. There is no single place to see the entire portfolio in one view.
MERLIN CMS
From inverter-level faults to portfolio-wide performance, every asset visible in one cloud platform.
Projects
1310+
Clients
53+
Uptime
99.9%
2 GW
Wind
3 GW
Solar
IEC 61724
Compliant
50+
Empirical KPIs
THE CHALLENGE
Plant managers juggle multiple dashboards, spreadsheets, and OEM portals. There is no single place to see the entire portfolio in one view.
Faults and performance losses are identified only after energy is impacted, with no proactive alerting system in place.
Performance reports for clients, lenders, or auditors are compiled manually every month, pulling data from disconnected sources with no audit trail.
THE SOLUTION
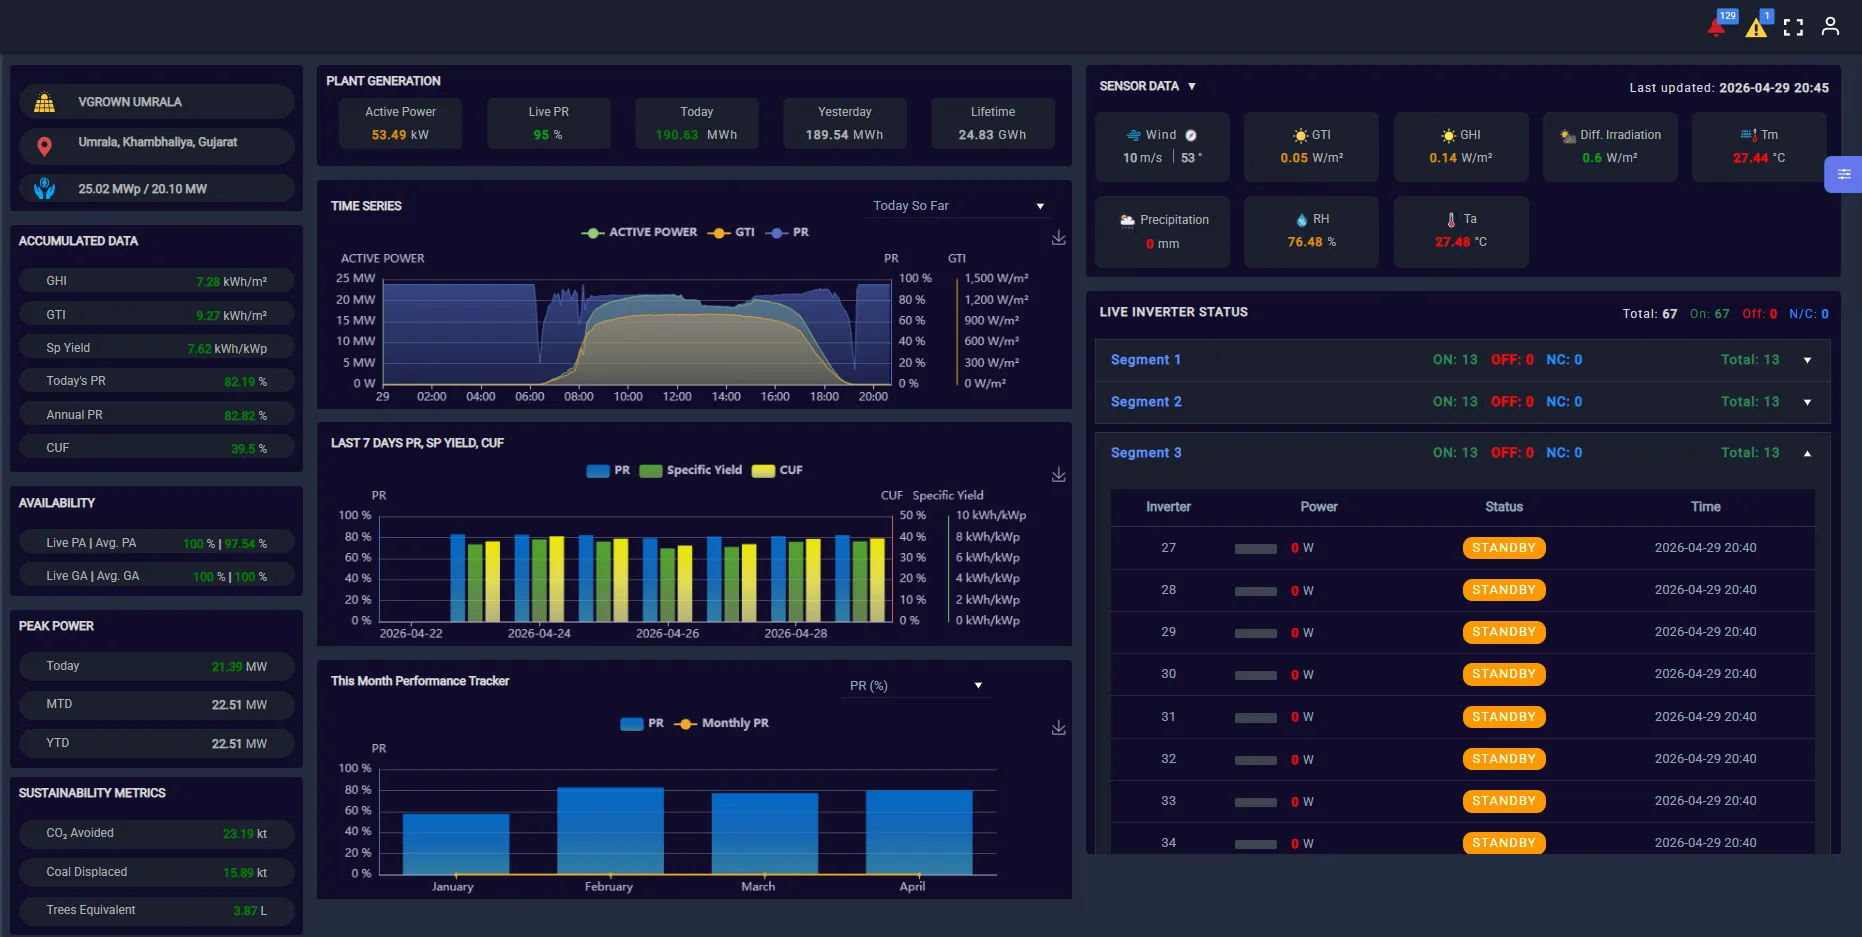
Track every plant, every inverter, and every string across your entire fleet from a single cloud dashboard. Plant-wise and inverter-wise performance ranking updates continuously so your team always knows which asset needs attention first.
Monitor every solar plant, wind farm, inverter, and string across your entire renewable portfolio through a unified cloud-based dashboard.
The Merlin Inverter Health Index (IHI) scores every inverter daily using multi-dimensional performance data. Degrading inverters are flagged before they fail, giving O&M teams time to act rather than react.
The Merlin Inverter Health Index (IHI) scores every inverter daily using multi-dimensional performance data. Degrading inverters are flagged before they fail, giving O&M teams time to act rather than react.
The platform identifies and categorizes energy losses specific to wind assets—such as wake effects, curtailment, turbine underperformance, and grid constraints. Each loss is quantified and linked to revenue impact, enabling operators to take targeted actions and maximize generation efficiency.
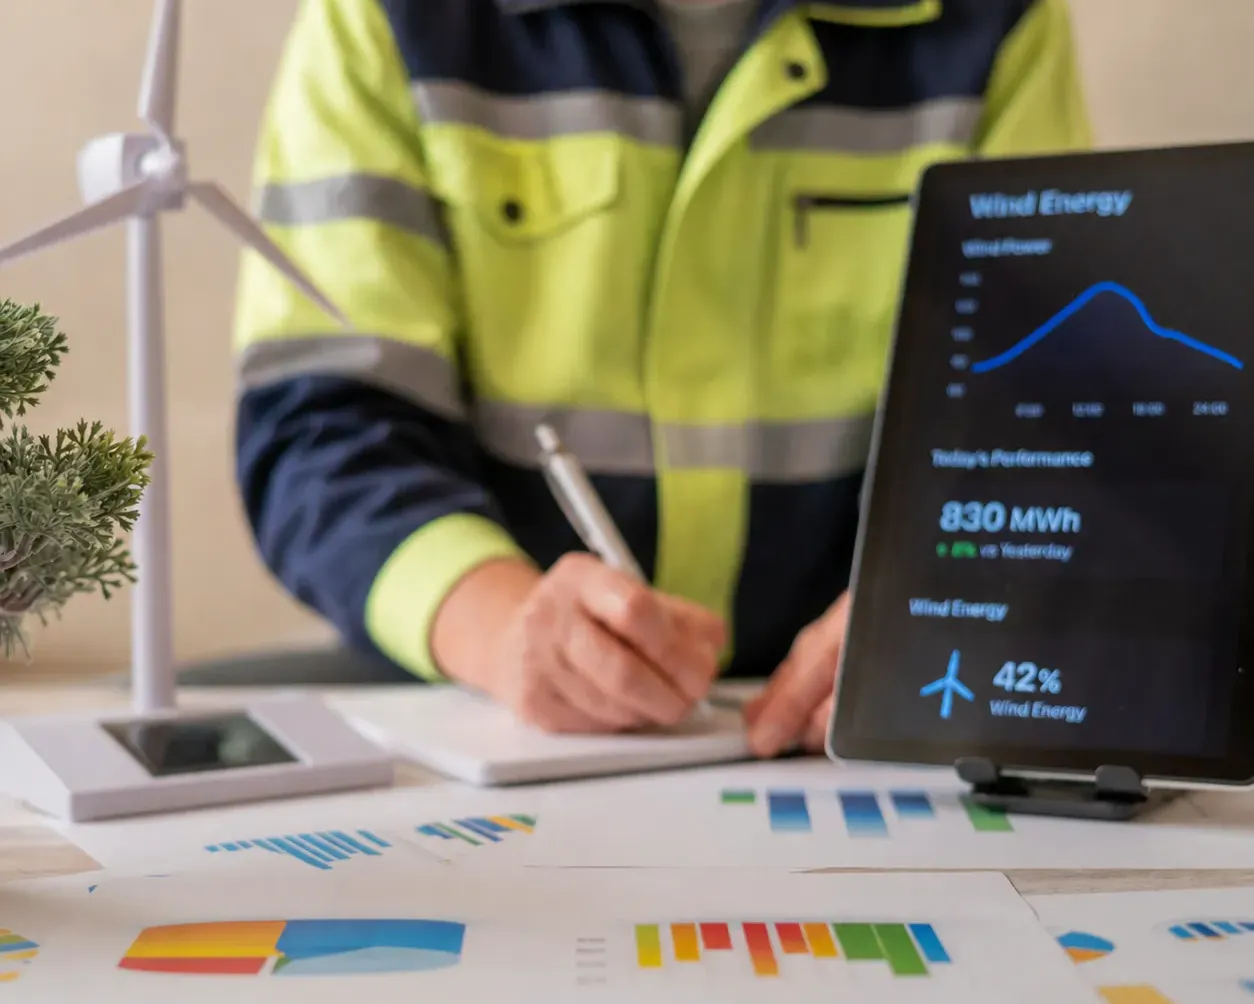
The platform identifies and categorizes energy losses specific to wind assets—such as wake effects, curtailment, turbine underperformance, and grid constraints. Each loss is quantified and linked to revenue impact, enabling operators to take targeted actions and maximize generation efficiency.
Topology-accurate fault localisation with live power flow. GIS layering lets operators drill from portfolio view down to string level without switching tools. Dynamic SLDs reflect real-time status for every asset in the plant.
Topology-accurate fault localisation with live power flow. GIS layering lets operators drill from portfolio view down to string level without switching tools. Dynamic SLDs reflect real-time status for every asset in the plant.
Analytics and Reporting
IEC 61724 compliant KPIs, automated compliance reports, and AI-driven anomaly detection, all in one place.
Daily and monthly performance ratio with weather-normalised benchmarking
Visual ranking of inverter efficiency across your entire fleet
Cross-plant and cross-cluster performance comparison with units lost calculation
Soiling, thermal, mismatch, and clipping losses broken out automatically
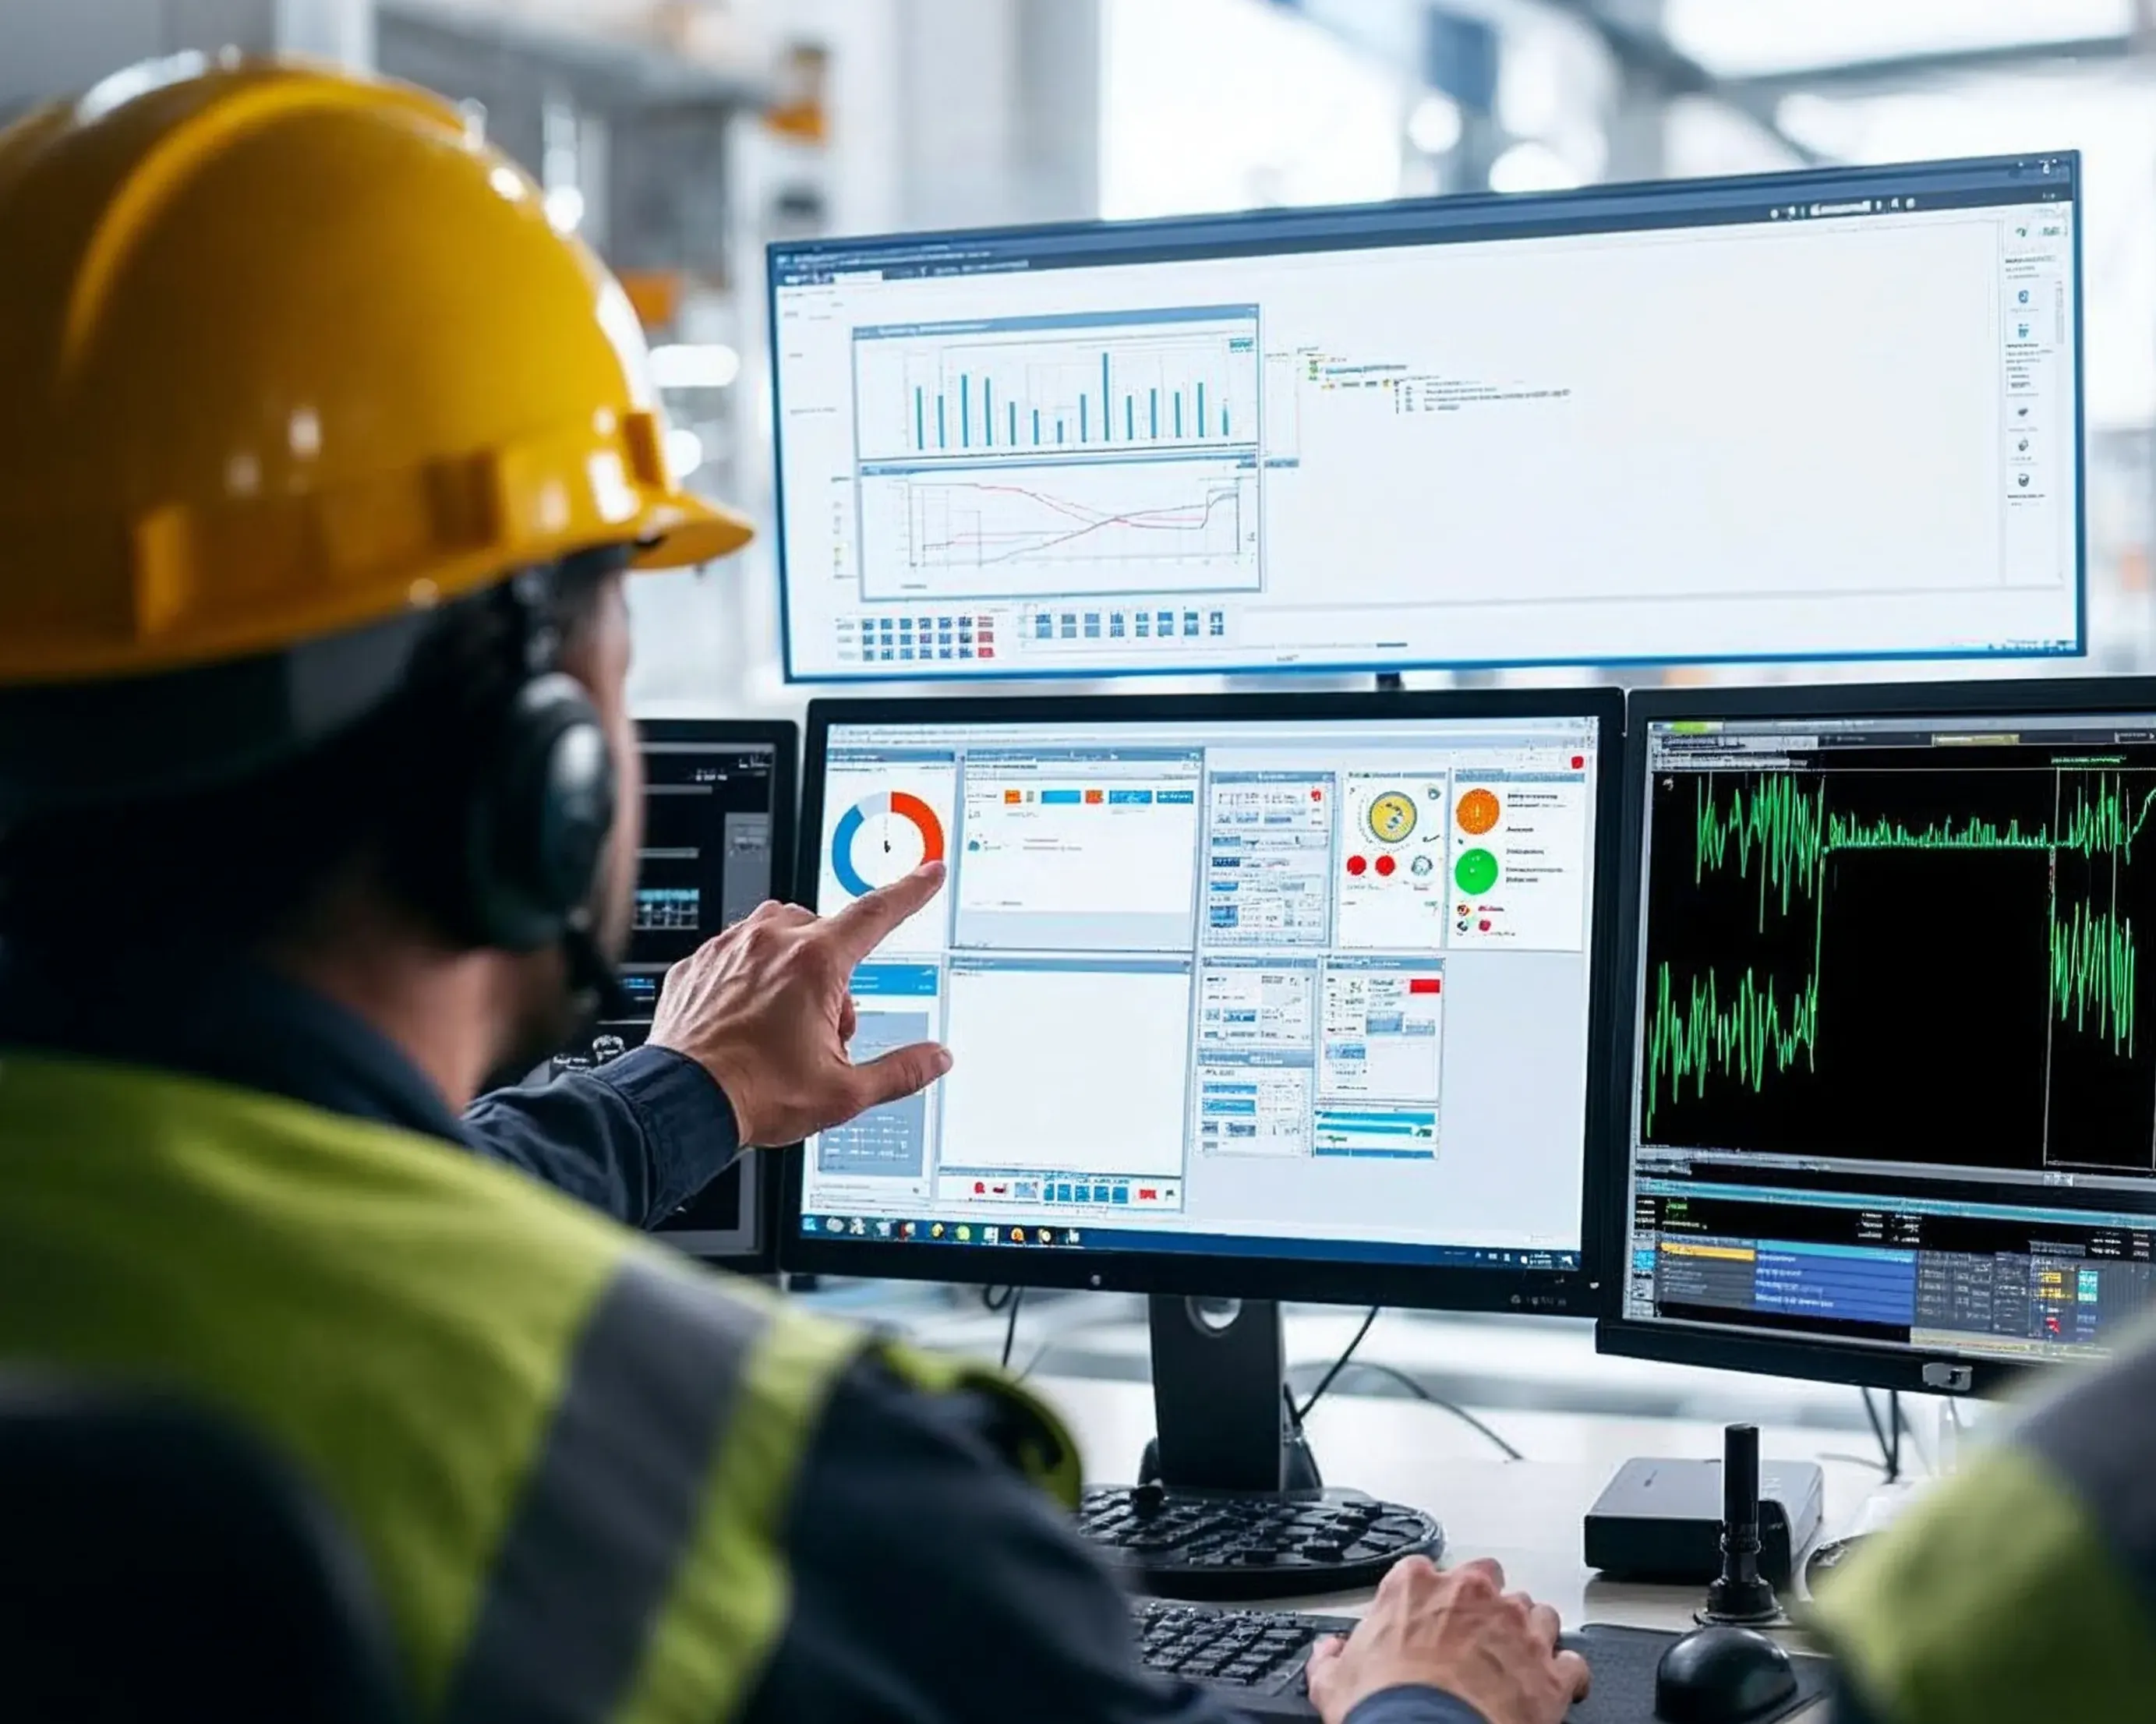
HOW IT WORKS
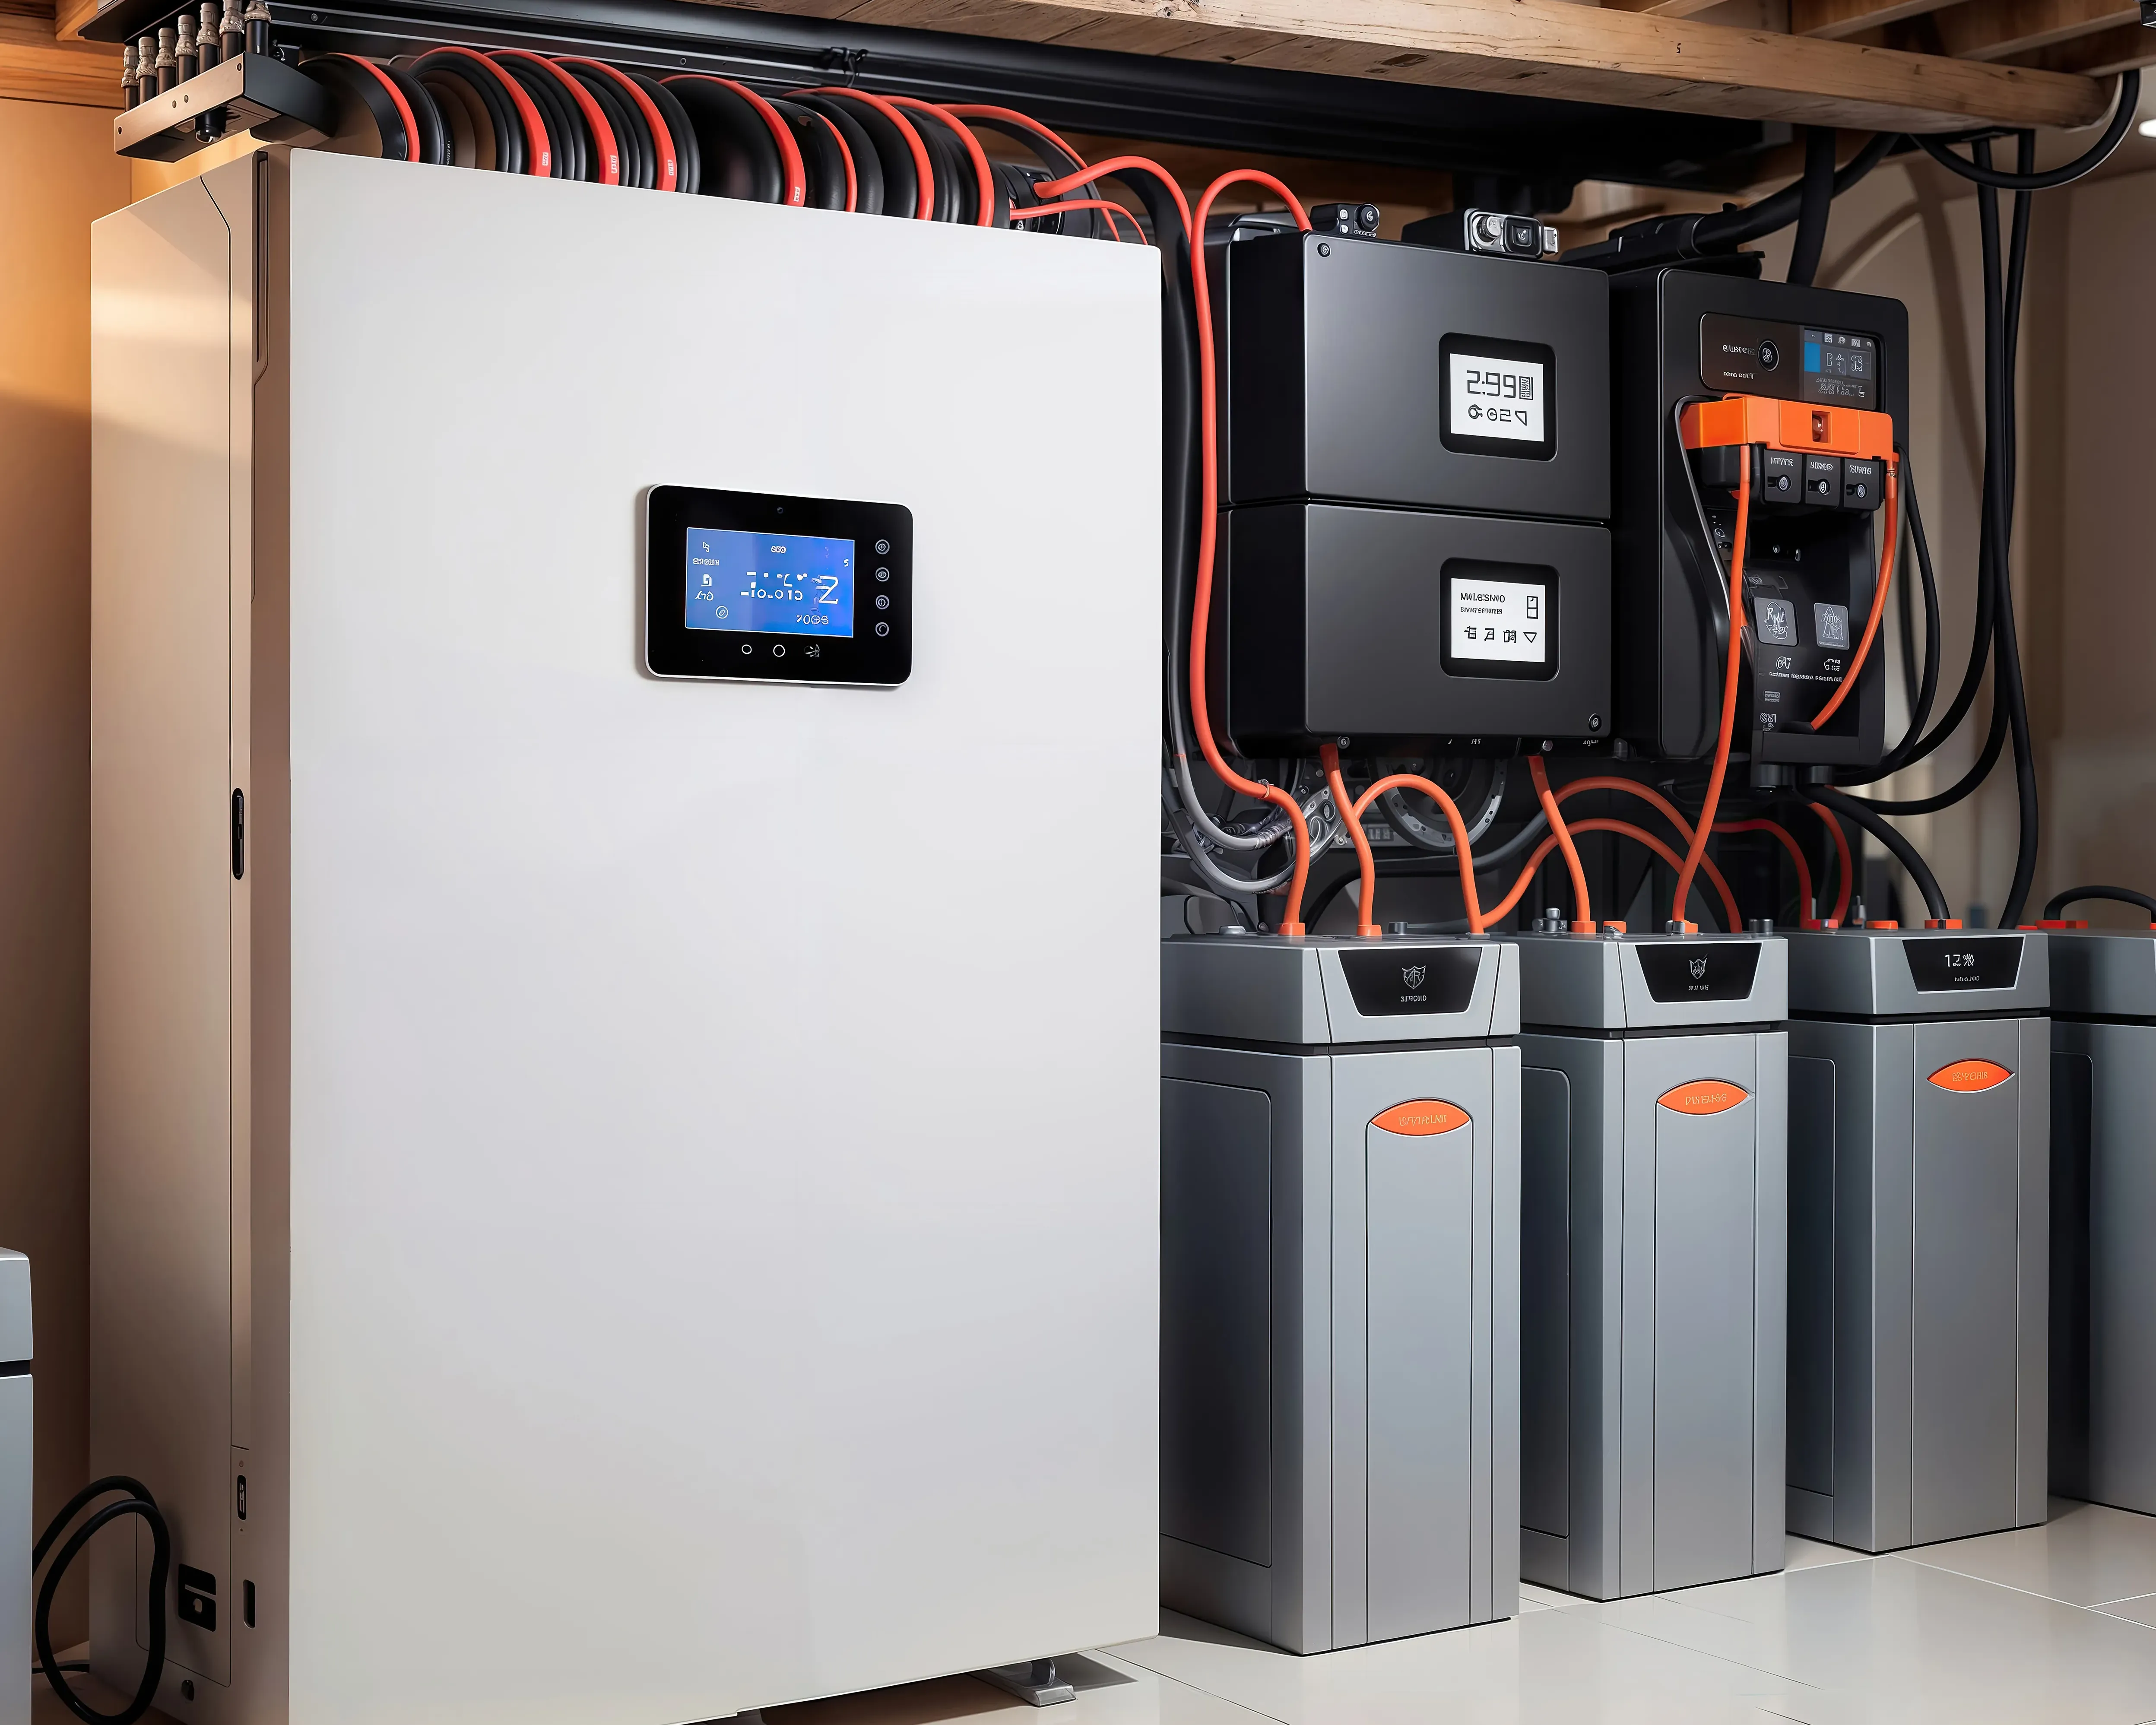
Merlin LDMS hardware at each site collects inverter, weather, and meter data at 1 to 15 minute intervals. Multi-protocol support covers Modbus, IEC 61850, IEC-104, OPC-UA, MQTT, and HTTP. Data is validated and compressed before transmission.
Aggregated data flows to the Merlin cloud, where plant-wise and portfolio-level dashboards are updated in real time. GIS maps, SLDs, inverter rankings, and fault logs refresh automatically. No manual data entry at any step.
Loss bucketing, health scoring, anomaly detection, and compliance KPI calculations run continuously. Pre-emptive alerts are dispatched by role. Automated daily, monthly, and annual reports are generated without operator intervention.
Compatible with inverters, meters, and weather stations from all major OEMs
BUSINESS IMPACT
3-5%
yield improvement
Optimisation
3-5% yield improvement through proactive soiling loss tracking and targeted cleaning cycle optimisation
20-30%
reduction
Fault Response Time
20-30% reduction in fault response time through pre-emptive alerts and AI-based inverter health scoring.
100%
audit-ready reporting
IEC 61724 compliant KPIs
100% audit-ready reporting with IEC 61724 compliant KPIs and automated monthly compliance reports.
Trusted By
Trusted by renewable energy operators for fleet monitoring, performance visibility, and operational control.
.svg)
.jpg&w=3840&q=75)
.png&w=1920&q=75)
.webp&w=3840&q=75)
.png&w=750&q=75)
.png&w=3840&q=75)
.svg)
.png&w=3840&q=75)
.svg)
Deployable As
Get Started
Book a walkthrough or share your fleet details for a tailored deployment plan.